

- Ethereum gas fees fell to an all-time low on Saturday as ETH supply continued its uptrend.
- Global Ethereum ETFs saw minor inflows of $4.2 million last week, while their U.S. counterparts saw outflows of over $14 million.
- Ethereum could repeat the historical trend after breaking the lower trend line of a key ascending triangle.
Ethereum fell over 3% on Monday following weak inflows via ETH ETFs and record lows in gas fees last week. The decline also coincides with ETH’s attempt to repeat a historic price move it has experienced over the past two years.
Daily Market Drivers Overview: Ethereum’s Low Gas Fees Coincide with Weak ETF Flows
Over the past week, Ethereum’s average daily gas fee hit an all-time low of 1.06 Gwei on Saturday, according to data from Ultrasound.money. Gwei is the measure of transaction fees on Ethereum.
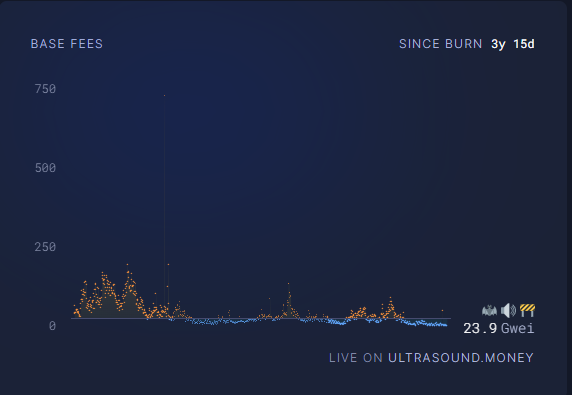
ETH gas fees since the London Hard Fork
The gas fee cut also meant that ETH’s burn rate dropped to 115 ETH on Saturday, according to data from CryptoQuant. While periods of record-low gas fees have often coincided with a price low in the past, the market outlook may be different this time due to the Dencun upgrade on March 13.
The Dencun upgrade introduced blobs, which allow layer-2 networks to publish data to the mainchain at significantly lower fees. As a result, ETH’s burn rate – which is intended to offset new issuance – has continued to decline.
Between April and August 2024, Ethereum’s total supply increased by over 220,000 ETH and its price dropped by more than 30%. A sustained uptrend in supply could negatively impact ETH price if demand decreases or remains constant. This could be a possible reason why Ethereum ETFs are not yet affecting prices.
Meanwhile, Ethereum ETFs saw net inflows of $4.2 million last week, according to CoinShares data. Although global inflows were positive, US spot ETH ETFs saw net outflows of $14.1 million. The weak inflows indicate caution among investors, as evidenced by the choppy price action and the ETH Fear and Greed Index at 34.
The ETH Fear and Greed Index measures investor sentiment towards Ethereum using scores from 0 to 100. A sharp rise in the index indicates major greed, while falling scores indicate FUD (fear, uncertainty, and doubt).
ETH Technical Analysis: Ethereum is close to repeating key historical price move
Ethereum is trading at around $2,570 on Monday, down over 3% on the day. In the last 24 hours, ETH recorded $30.8 million in liquidations, with long and short liquidations accounting for $28 million and $2.8 million, respectively.
The Ethereum derivatives market shows that most traders are bearish as funding rates turned negative earlier today, as per data from CryptoQuant. Funding rates are regular payments that long/short traders pay/receive when the price of perpetual futures contracts trades above or below that of its spot counterpart. They are also used as a type of sentiment indicator to know whether traders are optimistic or pessimistic.
Ethereum’s funding rate is hovering around -0.0036 at the time of writing, indicating that short positions dominate.
The bearish sentiment is also clearly visible on the 4-hour chart, where ETH broke the rising lower trend line of an ascending triangle on Sunday. Such a move suggests that sellers are gaining momentum and could trigger a dominant bearish trend.
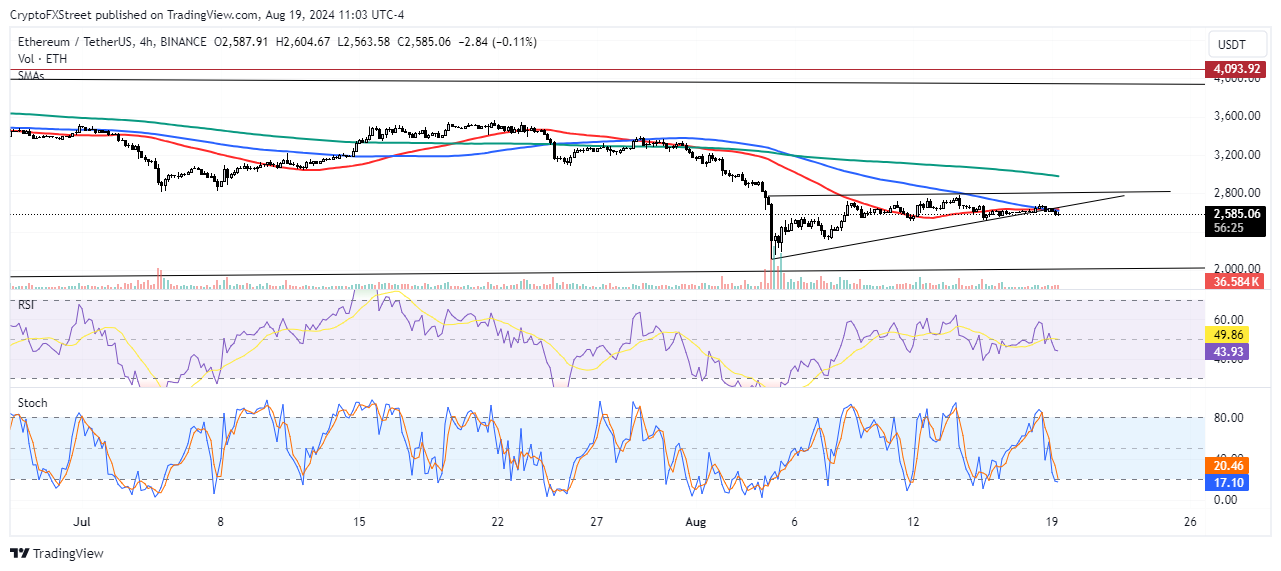
ETH/USDT 4-hour chart
However, the stochastic oscillator during this period suggests that ETH could see a recovery after falling below the $20 mark and entering the oversold zone. On the other hand, the Relative Strength Index (RSI) signals a bearish move after falling below its mean and moving averages.
Meanwhile, ETH continues to face resistance around a descending trendline on the daily chart. The trendline, recorded from May 30 to September 29, suggests that ETH could drop to a $2,000-$2,200 range in the coming weeks before a major recovery.
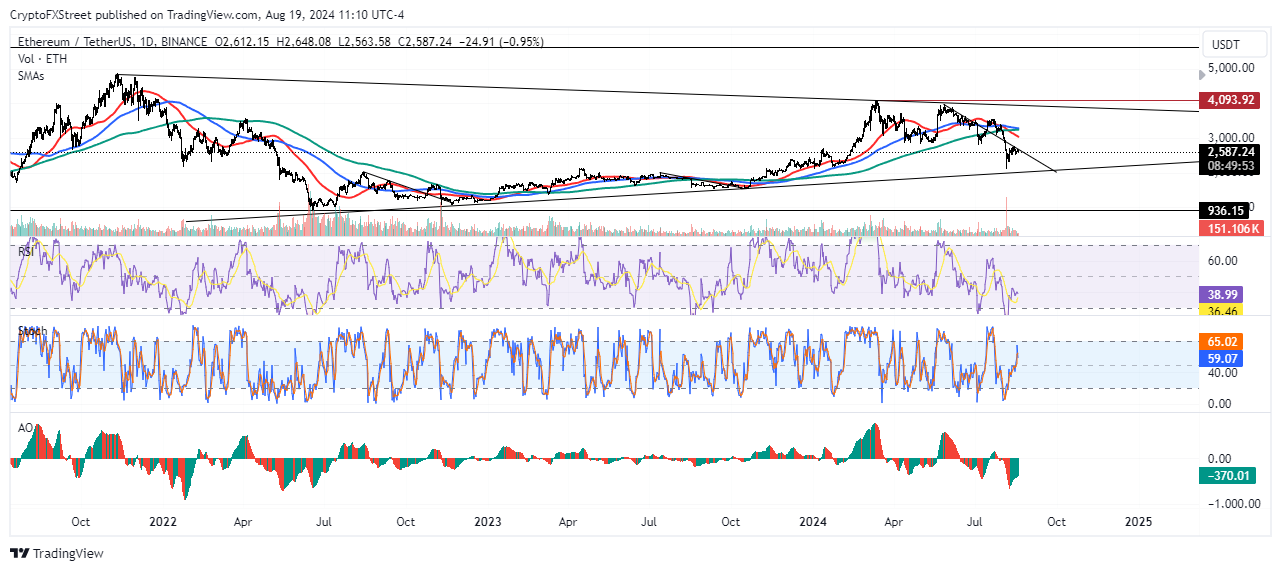
ETH/USDT daily chart
ETH saw similar movements from August 2022 to November 2022 and from July 2023 to October 2023. Furthermore, the Awesome Oscillator (AO) on the daily chart suggests that the bearish momentum is fading.
In the short term, ETH could briefly rise to $2,648 to liquidate positions worth $21.12 million.
Frequently Asked Questions About Cryptocurrency Metrics
The developer or creator of each cryptocurrency decides the total number of tokens that can be minted or issued. Only a certain number of these assets can be minted through mining, staking or other mechanisms. This is defined by the algorithm of the underlying blockchain technology. Since its inception, a total of 19,445,656 BTCs have been mined, which is equal to the amount of Bitcoin in circulation. On the other hand, the amount in circulation can also be reduced by actions such as burning tokens or accidentally sending assets to addresses of other incompatible blockchains.
Market capitalization is calculated by multiplying the circulating supply of a particular asset by its current market value. For Bitcoin, the market capitalization is over $570 billion as of early August 2023, which is calculated by multiplying the over 19 million BTC in circulation by the Bitcoin price of around $29,600.
Trading volume refers to the total number of tokens for a particular asset that have been traded or exchanged between buyers and sellers within set trading hours, such as 24 hours. It is used to gauge market sentiment. This metric combines all volumes on centralized and decentralized exchanges. Increasing trading volume often indicates demand for a particular asset as more people are buying and selling the cryptocurrency.
Funding rates are a concept designed to encourage traders to take positions and ensure that the prices of perpetual contracts are in line with those of the spot markets. It defines a mechanism of exchanges that ensures that the periodic payments for future prices and index prices converge on a regular basis. When the funding rate is positive, the price of the perpetual contract is higher than the market price. This means that traders who are optimistic and have opened long positions pay traders who have short positions. On the other hand, a negative funding rate means that the prices of perpetual contracts are below the market price and therefore traders with short positions pay traders who have opened long positions.
